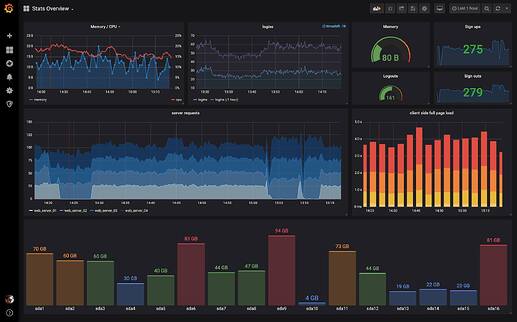
Grafana is a data visualization and monitoring platform that enables users to query, visualize, alert on and understand metrics, logs, and other data sources. It integrates with various data sources, including Prometheus, InfluxDB, Elasticsearch, and many others, to present a unified view of the data and enable users to create insightful and interactive dashboards.
To create a new Proxmox VE Grafana LXC, run the command below in the Proxmox VE Shell.
bash -c "$(wget -qLO - https://github.com/community-scripts/ProxmoxVE/raw/main/ct/grafana.sh)"
Default Settings: 512MiB RAM - 2GB Storage - 1vCPU
As an alternative option, you can use Alpine Linux and the Grafana package to create a Grafana LXC container with faster creation time and minimal system resource usage.
To create a new Proxmox VE Alpine-Grafana LXC, run the command below in the Proxmox VE Shell.
bash -c "$(wget -qO - https://github.com/community-scripts/ProxmoxVE/raw/main/ct/alpine-grafana.sh)"
Default Settings: 256Mib RAM - 500MiB Storage - 1vCPU
Grafana Interface: IP:3000
![]() Initial Login
Initial Login
username admin
password admin
